Transforming Lumosity Data into Engaging Experiences
Lumosity has over 95 million users with over 4.5 billion game plays – an unparalleled dataset, yet largely untapped. Meanwhile, our users were eager to learn more about their performance and how they can improve. Our goal was to utilize that data to create a more personalized experience to keep users engaged and motivated to continue training with Lumosity. We have delivered 12 distinct, personalized Insight reports that have led to improved conversion, engagement, and retention and have received praise from our most highly engaged users.
Overview
Problem
Access to the full game library was the core of our product and premium value proposition but we wanted to add value to the premium product in other ways. One way we could add value was by providing novel, non-game content. We know from thousands of products reviews, customer support emails, and user research that our users were eager to learn more about their performance and how they can improve. We offer stats and How You Compare, but these features lacked guidance and didn’t help users understand how they could improve.
With over 4.5 billion game plays from over 95 million users, we recognized a huge opportunity to leverage our data and deliver Insights content that fulfill user and business needs.
Goals
Make Lumosity training more personal and engaging through data.
Give users a deeper understanding of themselves and their progress.
Demonstrate how Lumosity relates to the real world.
Provide users with actionable recommendations.
Increase our value proposition through new Insights content.
Deliver ongoing subscriber value through cadence of new content.
Approach
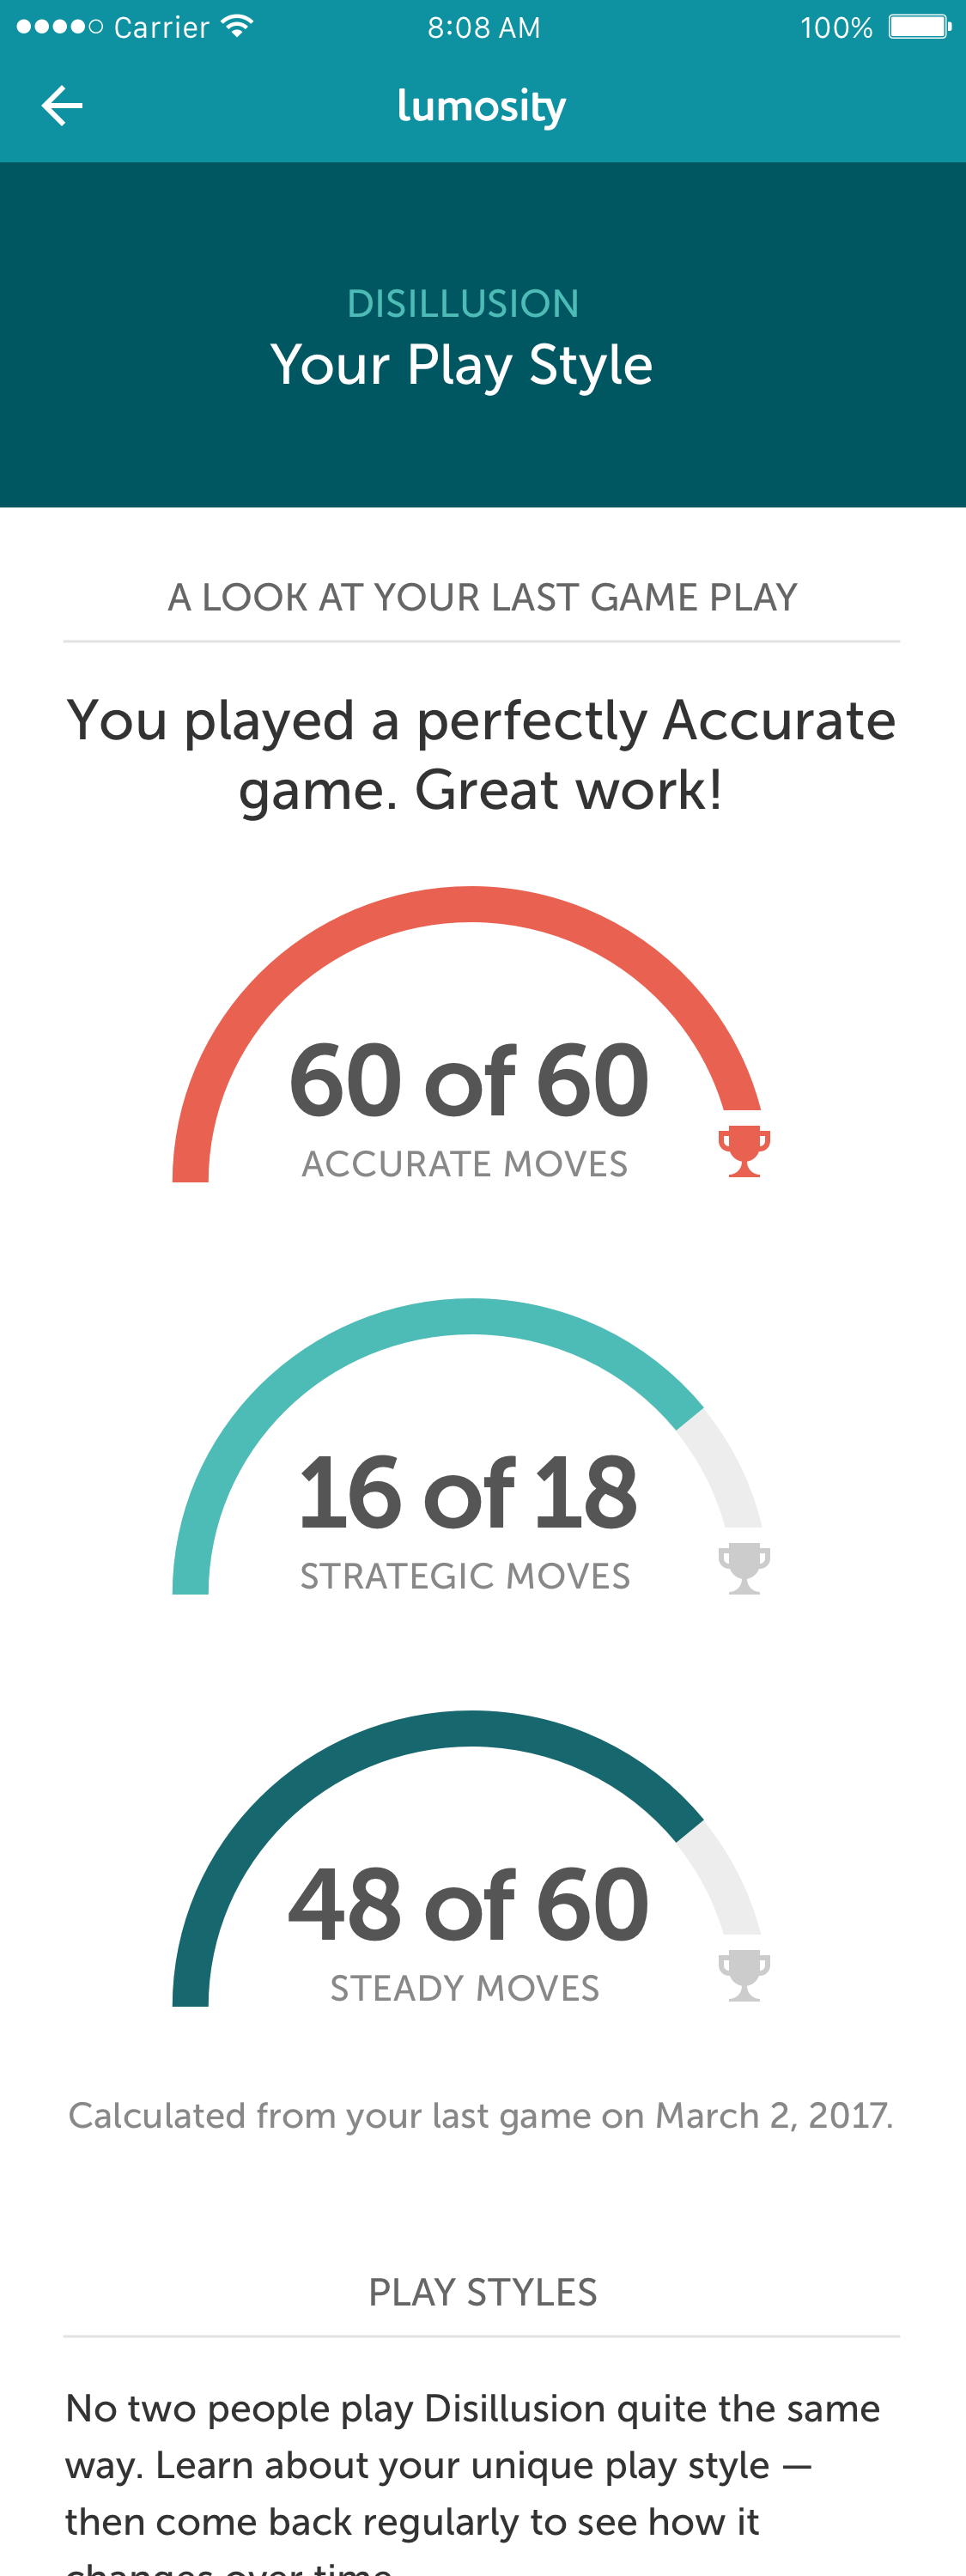
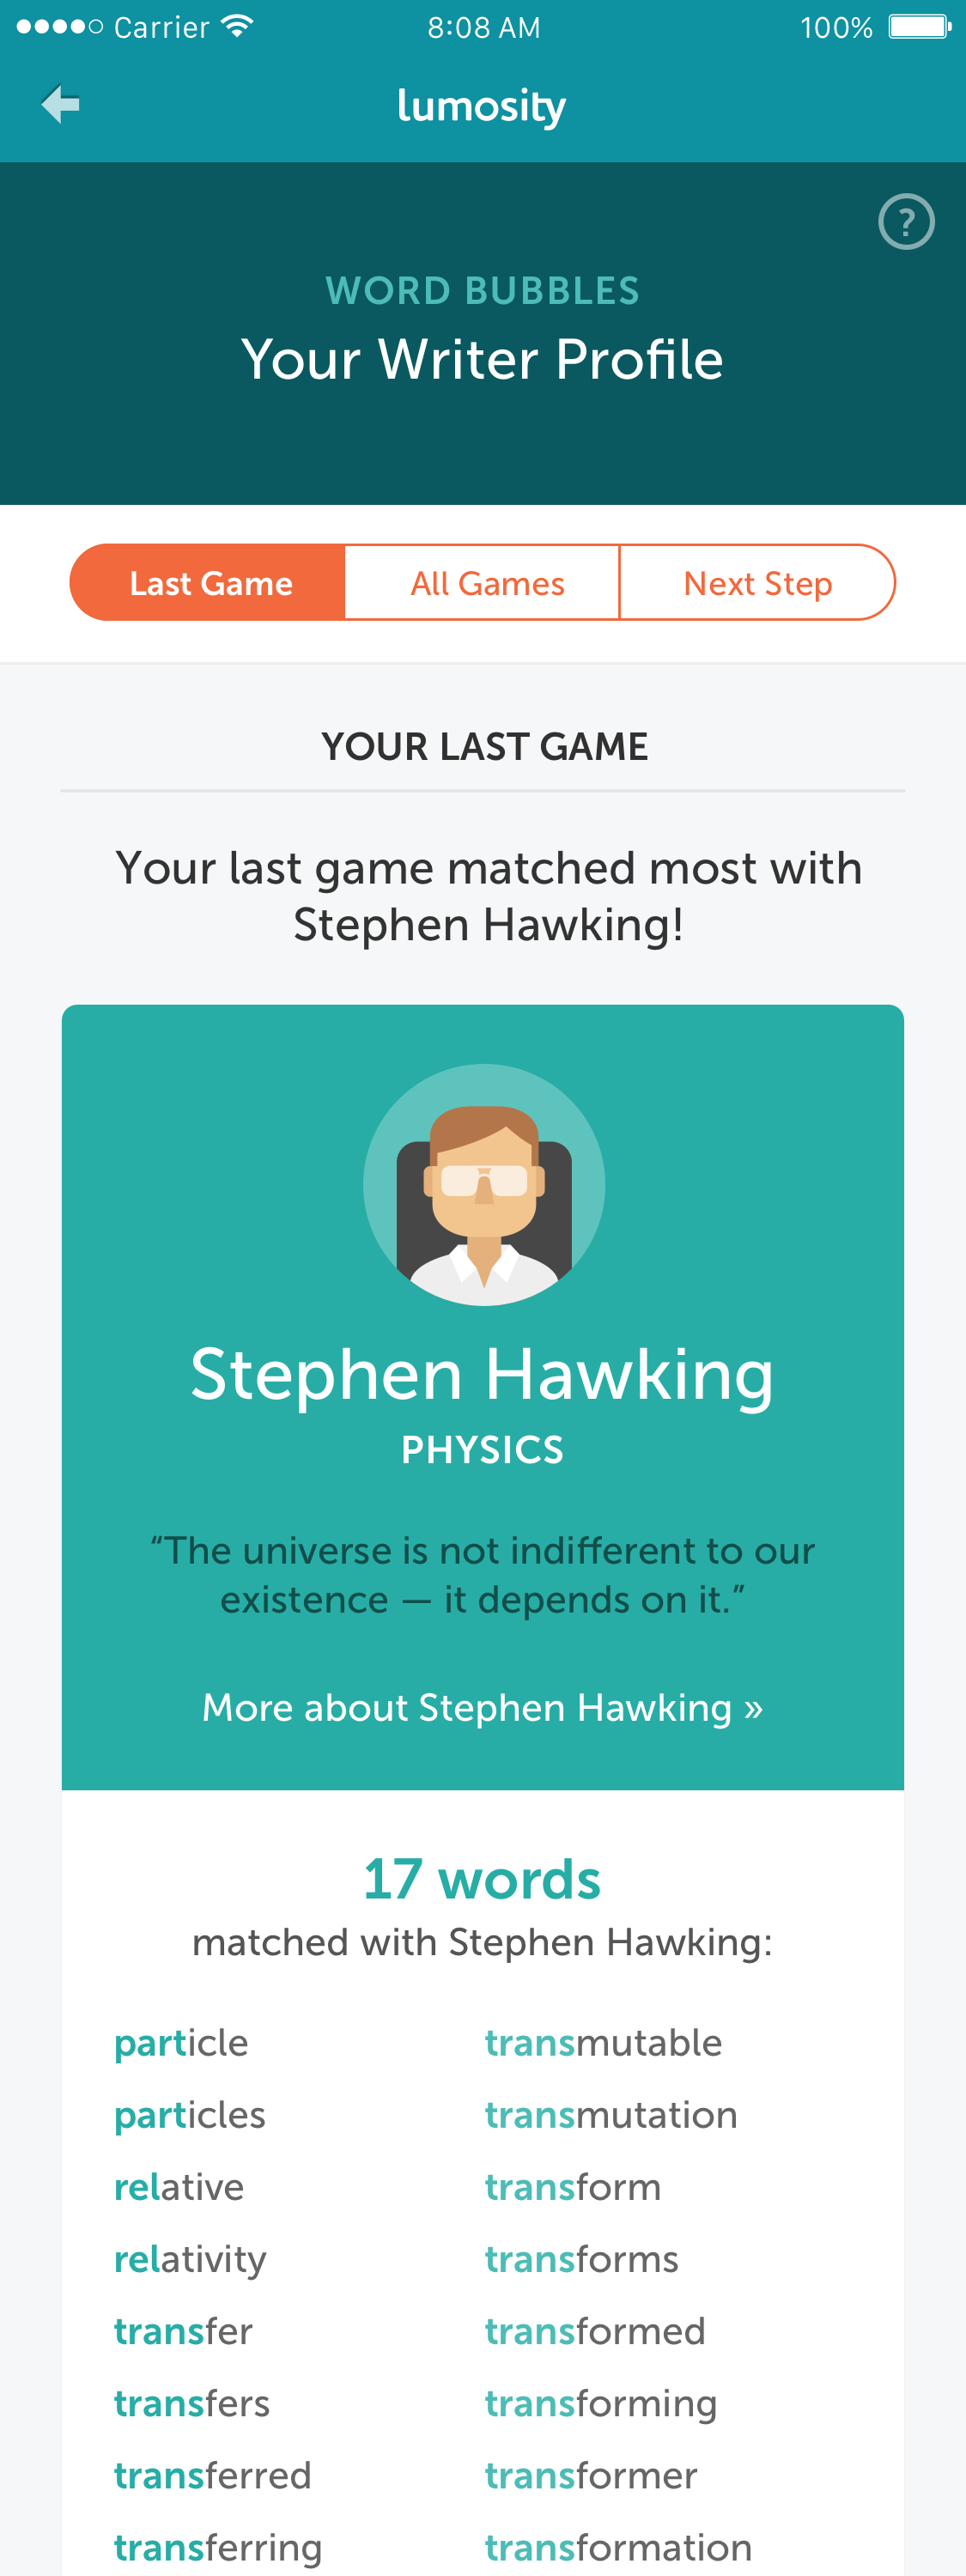
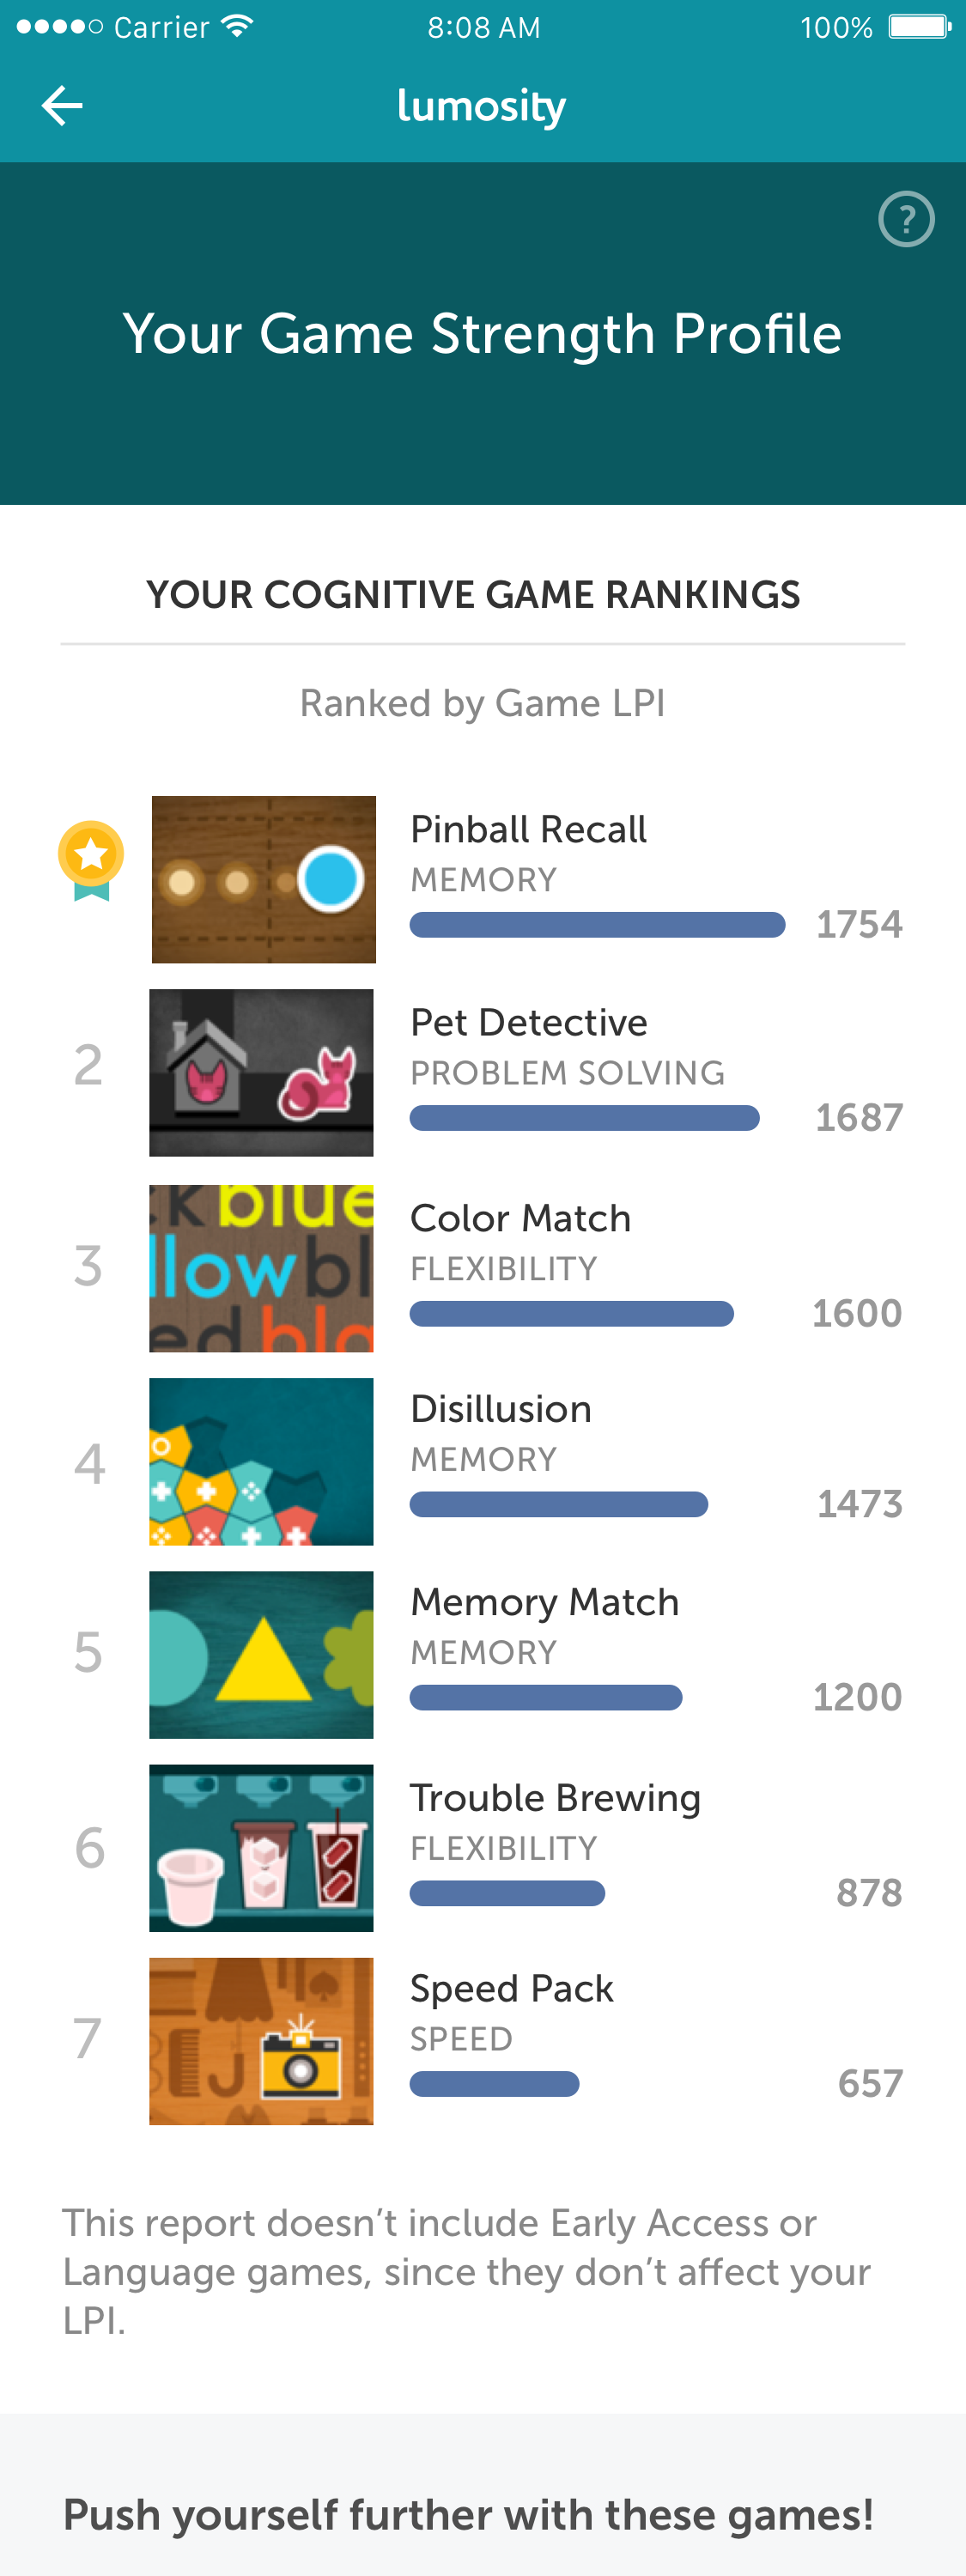
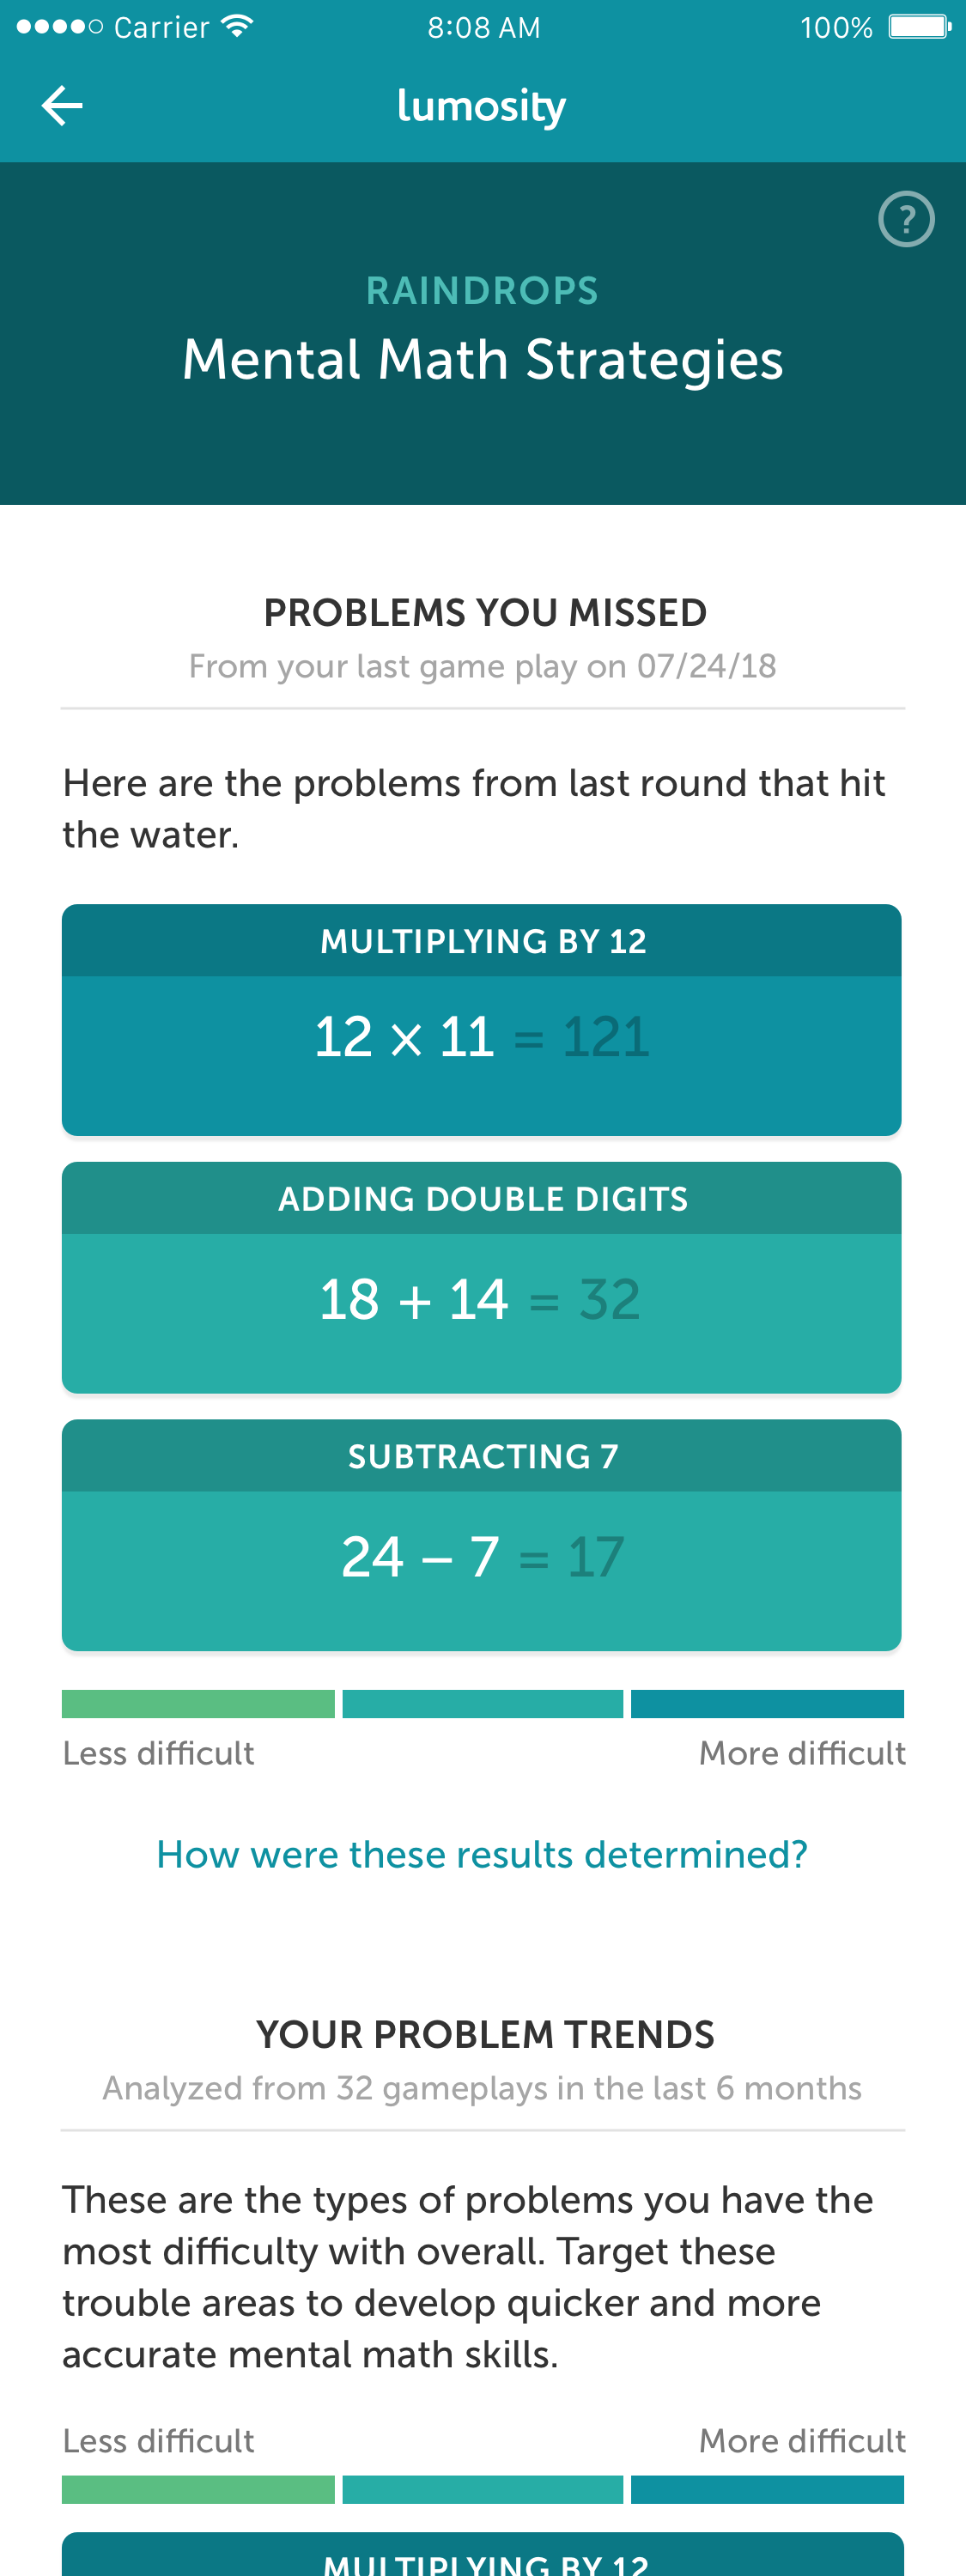
In order to deliver new Insights content, we first had to build the Insights content engine. Our strategy was to deliver a content cadence of engaging data-driven experiences, known as Insights, that met our goals. Our team explored many different concepts and to date, we have delivered 12 distinct Insight reports that have led to improved conversion, engagement, and retention and received positive feedback from our users.
My Role
The Insights Team was formed in Fall 2016 and initially comprised of two designers: a UX designer and myself as Senior Visual Designer. The other designer left shortly after our first launch and starting in March 2017, I led end-to-end design as Senior Product Designer, owning the entire Insights feature for almost 2 years and shipping a total of 12 Insight reports. My core responsibilities included but were not limited to:
User research
Creative ideation
Design strategy
Task flows
Wireframing
Prototyping
Usability testing
Interaction design
Visual/UI design
Data visualization
Illustration/iconography
Copywriting
I worked most closely with a product manager and data scientist on conceptualization and development of every Insight report. Additionally, I collaborated with visual and motion designers on art and animation and partnered with engineering and QA during implementation.
Research
We know from countless support emails, product reviews, and user research that our users want to learn more about their progress, their unique cognitive attributes, how lifestyle factors (sleep, exercise, etc.) impact cognition, and how they could improve.
USER DESIRES AND NEEDS
Users want to feel that they are progressing in some measurable way using Lumosity
Users want variety and novelty in their Lumosity experience
Users desire a deeper understanding of themselves
Users need more substance to Lumosity than just games to keep them interested
Defining “Insight”
In order to avoid any confusion, we had to first align on what “Insight” was. We defined an Insight as a feature that exposes and analyzes or interprets data for a user. “Insight” is not equivalent to “anything with data.” That being said, pure data-gathering or progress-tracking could be within the scope of Insights if it’s with the goal of making a story to tell the user.
What is an ideal insight?
Engaging - Primary goal. Improves D30 retention (and beyond)
Personalized - Shares knowledge relevant to each user
Self-sustaining - Generates data for future use
Expert - Provides trustworthy information that users can’t get elsewhere
Actionable - Helps a user progress toward his or her brain health goals
Integrated - Supports other parts of our business (e.g. tests areas of user interest; collects data for new initiatives; directs users to new features)
Shareable - Improves public view of Lumosity’s role in cognitive research/knowledge
What Can Insights do?
Explain progress and performance
Provide expert analysis of gameplay
Provide novelty/variety
Give real-world relevance (i.e. how lifestyle impacts cognition)
Create identity/sense of self
Promote vitality through sense of community
Ideation
As with any project, each report required a slightly different process depending on the available resources, scope, timeline and constraints. Early on in the process, we worked closely with marketing to determine timelines based on alternating campaigns with game releases in order to hit our target business metrics. This often meant that we had to prototype, test, iterate and execute designs very quickly on a tight schedule (often within 4 sprints or two months).
Crazy 8’s
The PM, data scientist, and I worked closely to interpret our data, brainstorm ideas and determine which concepts would be most meaningful to our users. I led brainstorm sessions and “crazy eights” with our team and with employees in other departments on occasion to solicit outside perspectives. We kept a growing backlog of ideas for future reports.
Prototyping & Testing
While our data scientist conducted analyses for us to test, the PM and I worked through the problem together to produce different concepts and Invision prototypes to test and validate. We tested concepts both internally and recruited users externally in order to validate our ideas, discover pain points, and collect feedback.
USER testing Framework
Some examples of questions and hypothesis I sought to validate in usability studies include:
Did the user find the report useful or meaningful? What did they learn?
Is the data clear? How did the user interpret their results? Do they feel empowered to improve?
How did the user feel about their performance after viewing the report?
What action would the user take when viewing the report? Would they play again? Would they return later?
What would the user do after viewing the report? Would they engage deeper in the product?
Would the user return to view the report at a later date? How soon would they return?
Would the user share this insight? How would they share it and with whom?
Did the report help them understand the value of cognitive training?
Design
Iteration & Feedback loops
Every report went through rounds of design iteration. I frequently solicited feedback through usability testing, design critiques, and check-ins with the engineering and localization teams to ensure I got feedback and guidance from all key stakeholders.
Creating delight through illustration and motion
To create more delight in the user experience, I teamed up with marketing and motion designers to help bring our Insight reports to life. I also worked closely with marketing teams to build compelling marketing campaigns around each Insight report release.
Production
After a concept and design was finalized, the next step was to account for all user states, empty states and edge cases. Finally, I optimized each report for every breakpoint in responsive web view. Over time, I developed an Insights-specific design system that allowed both myself and engineers to build reports more efficiently.
Final Designs
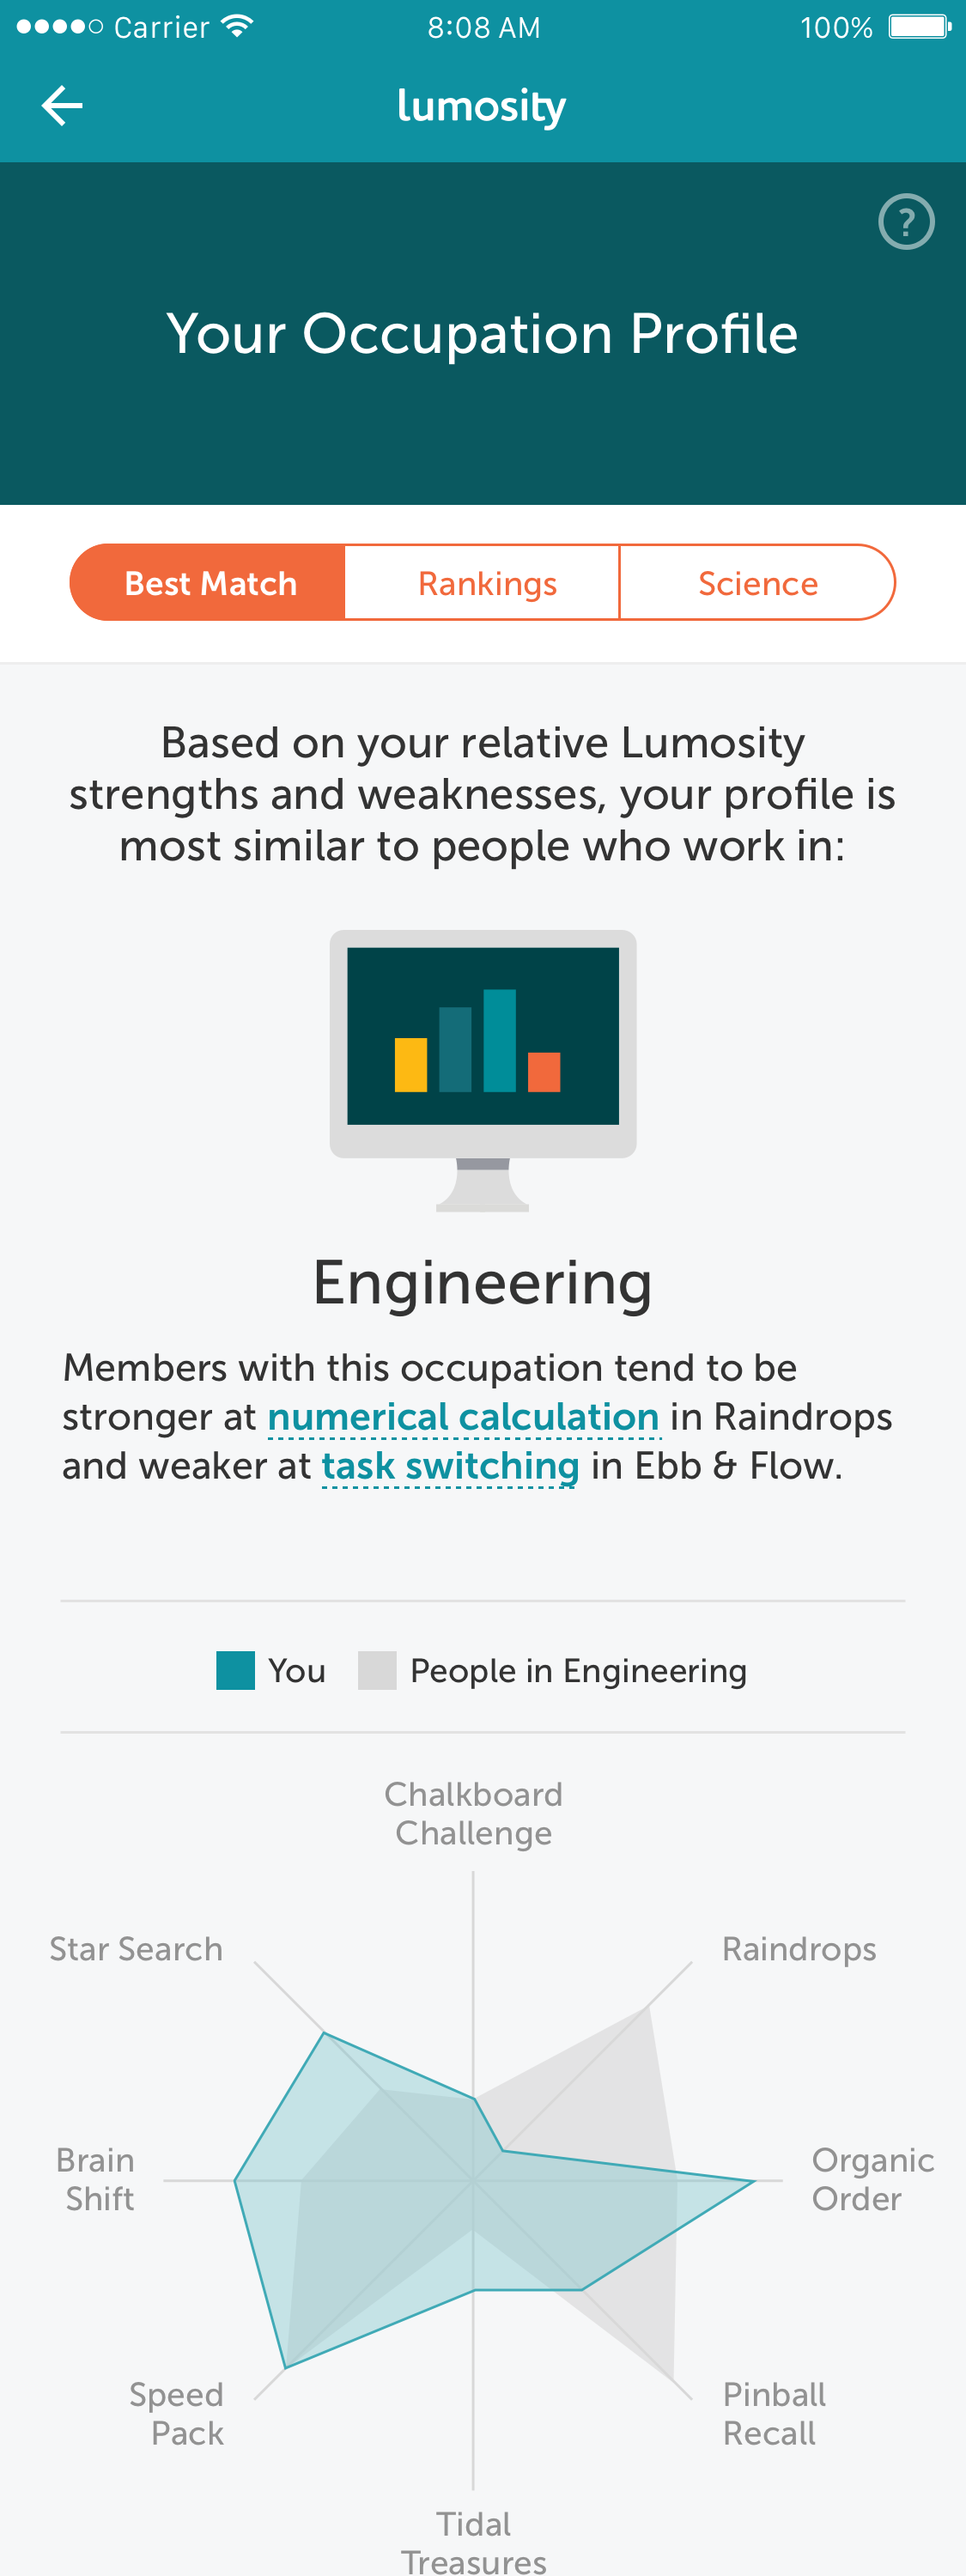
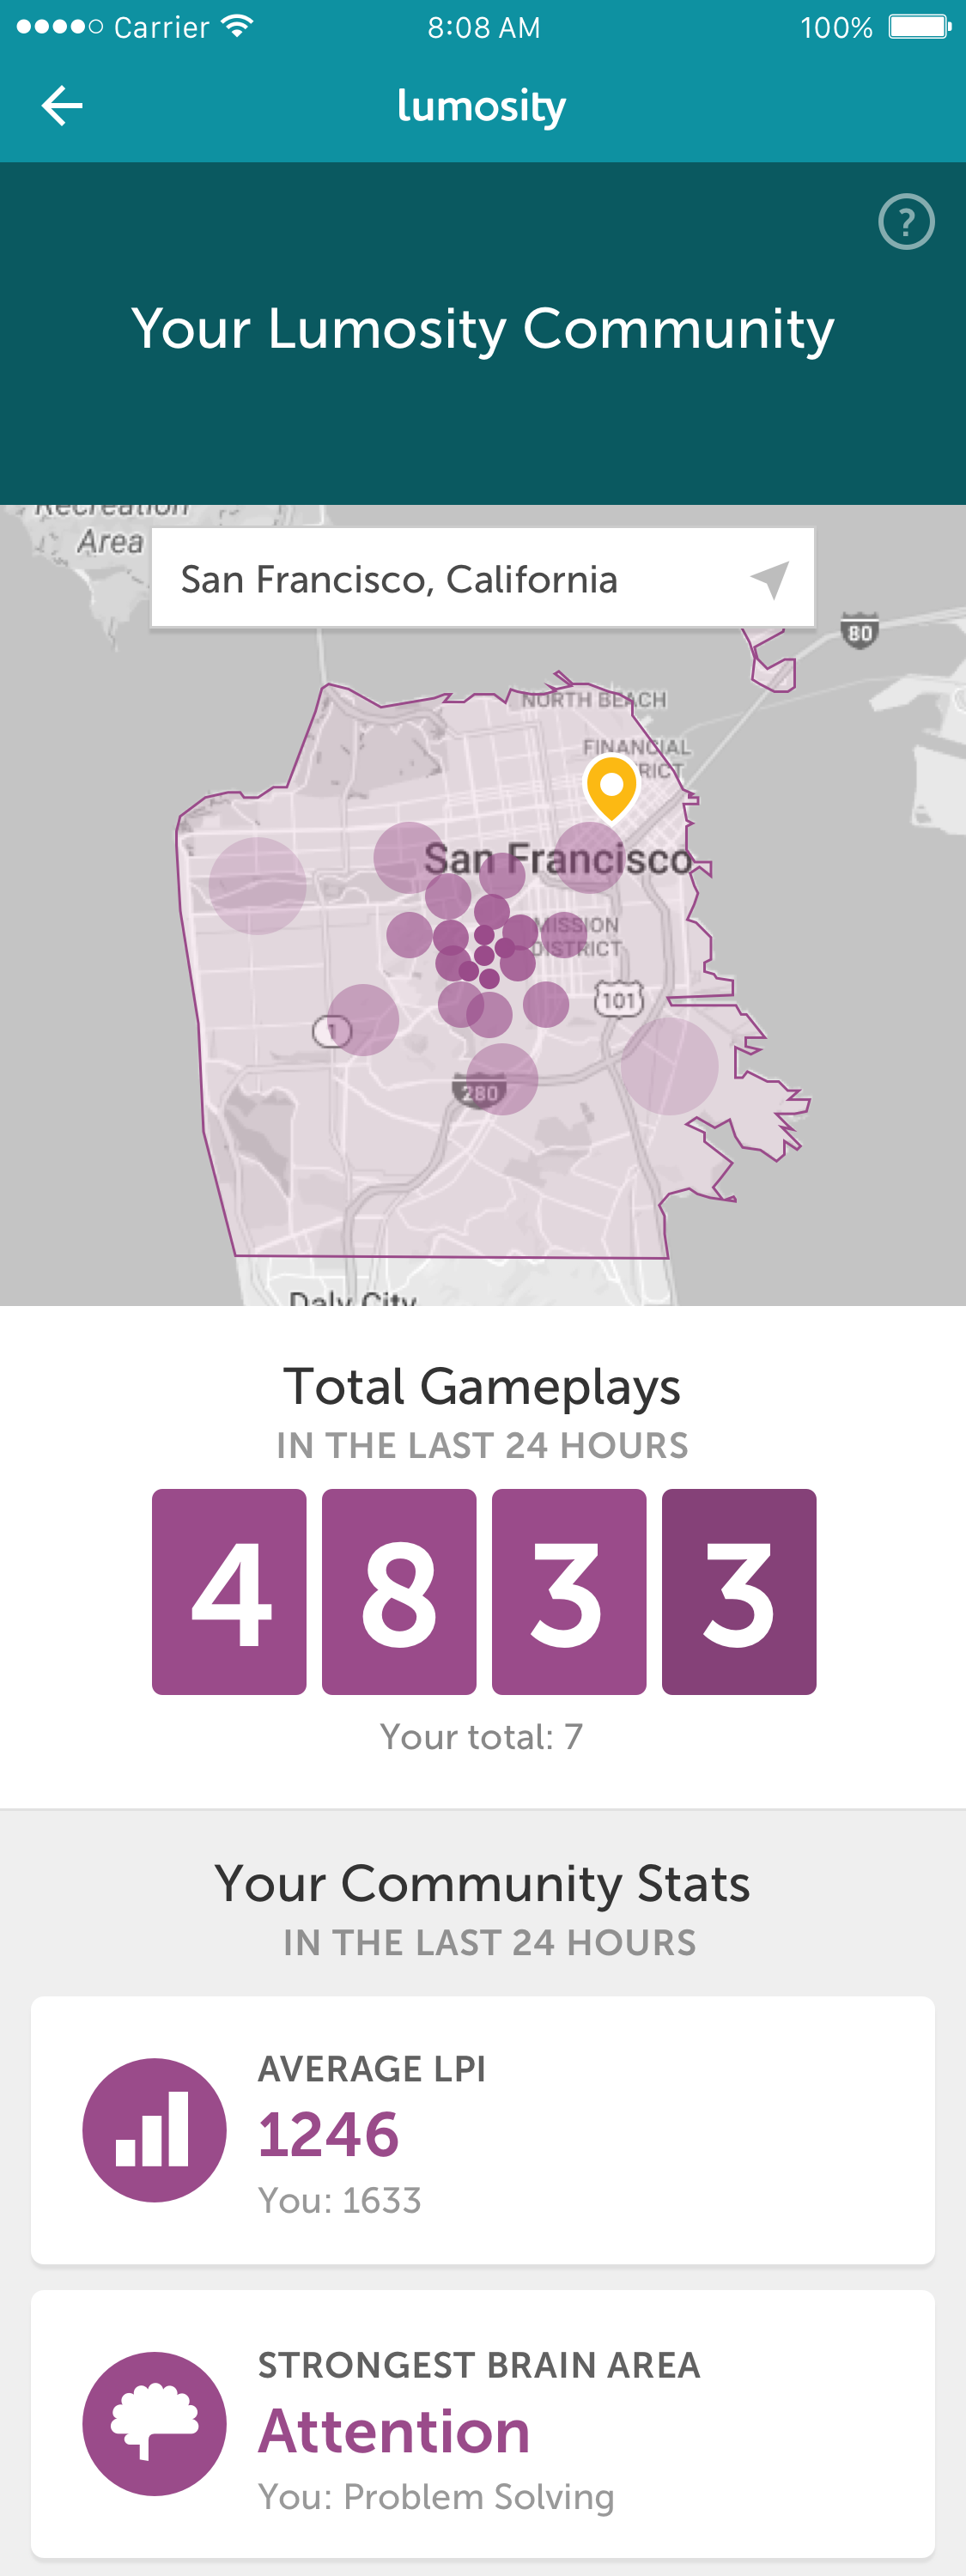
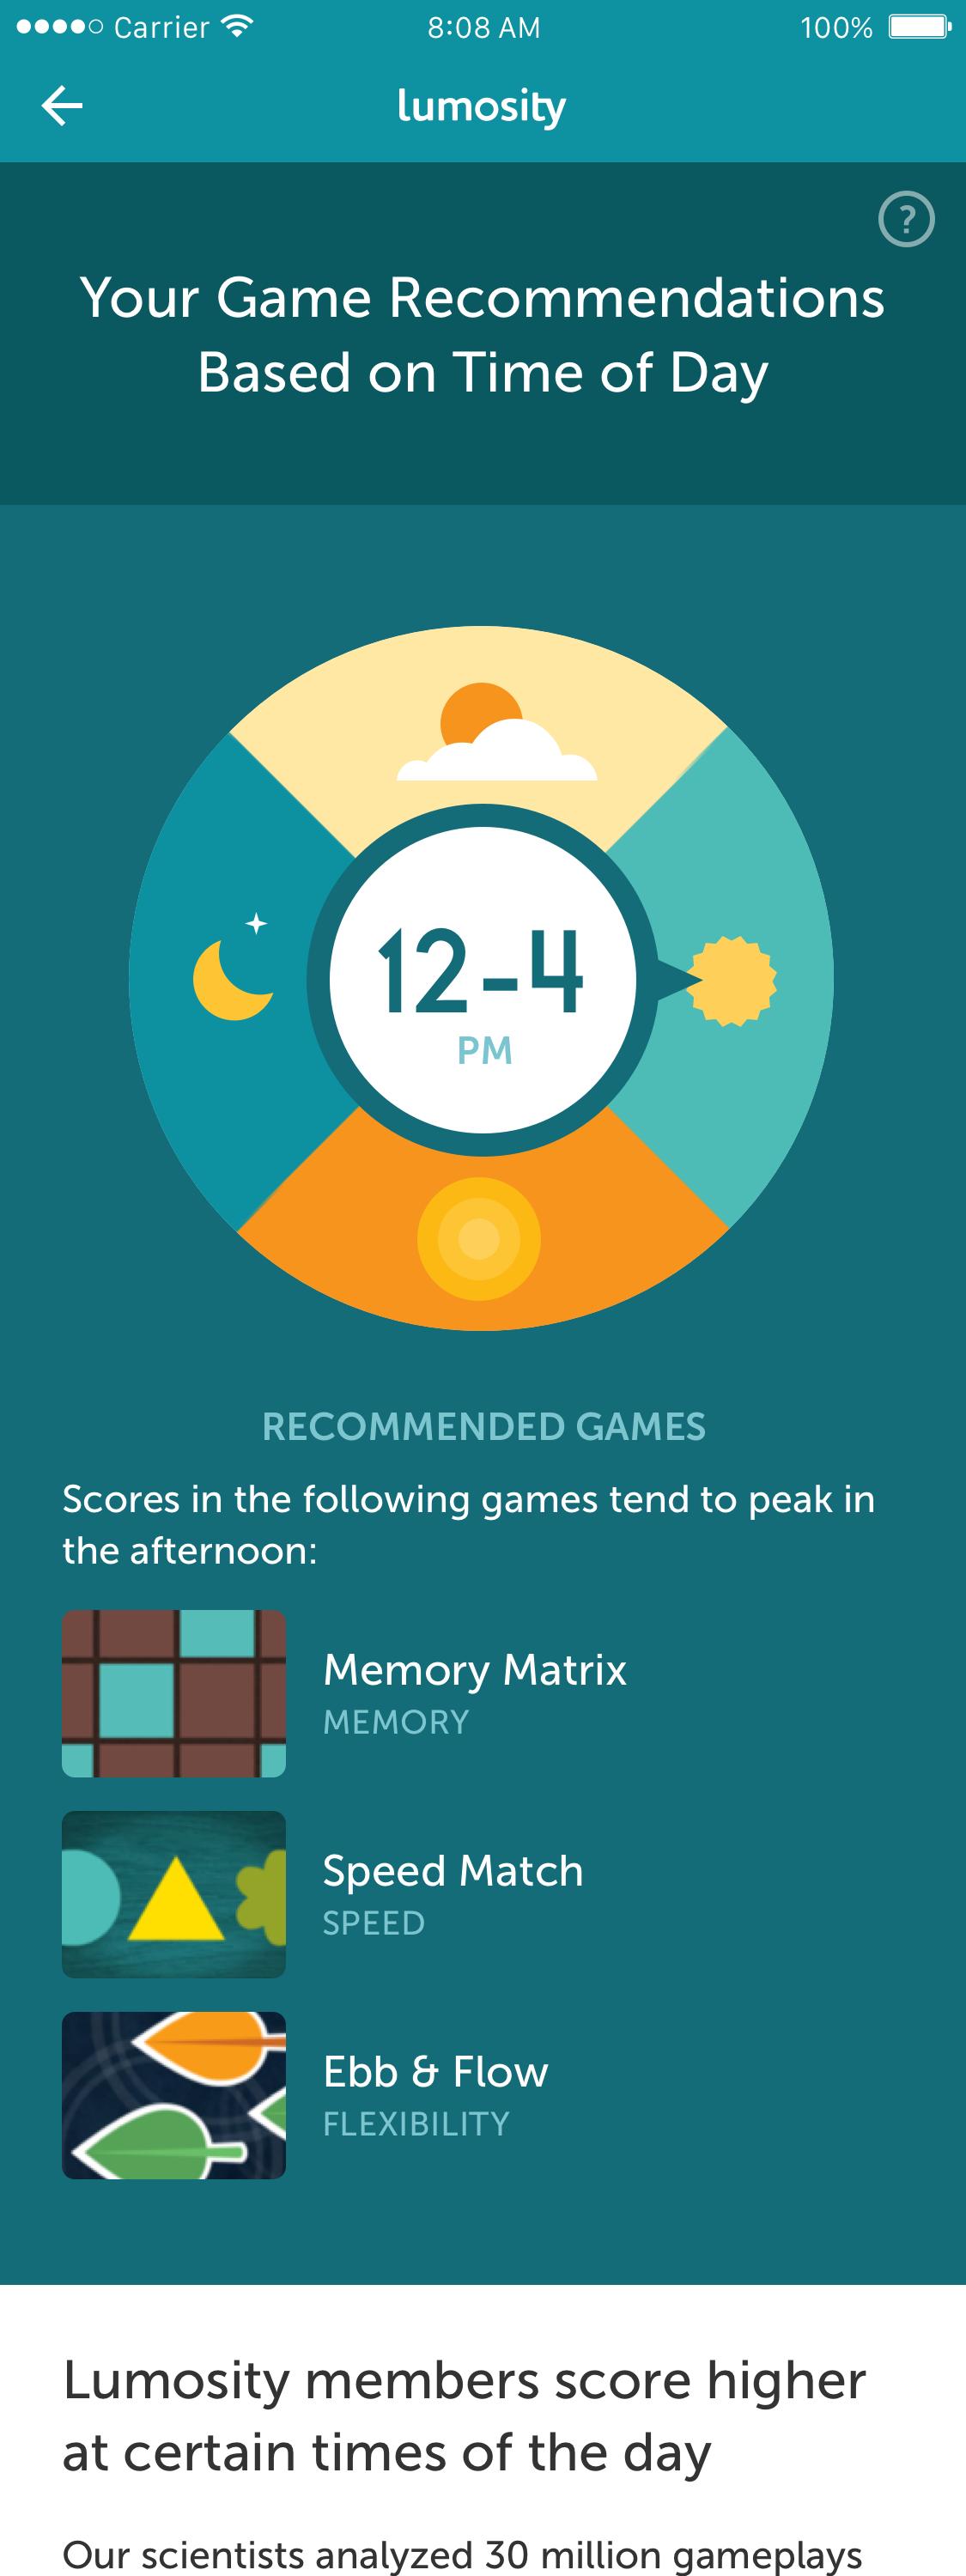
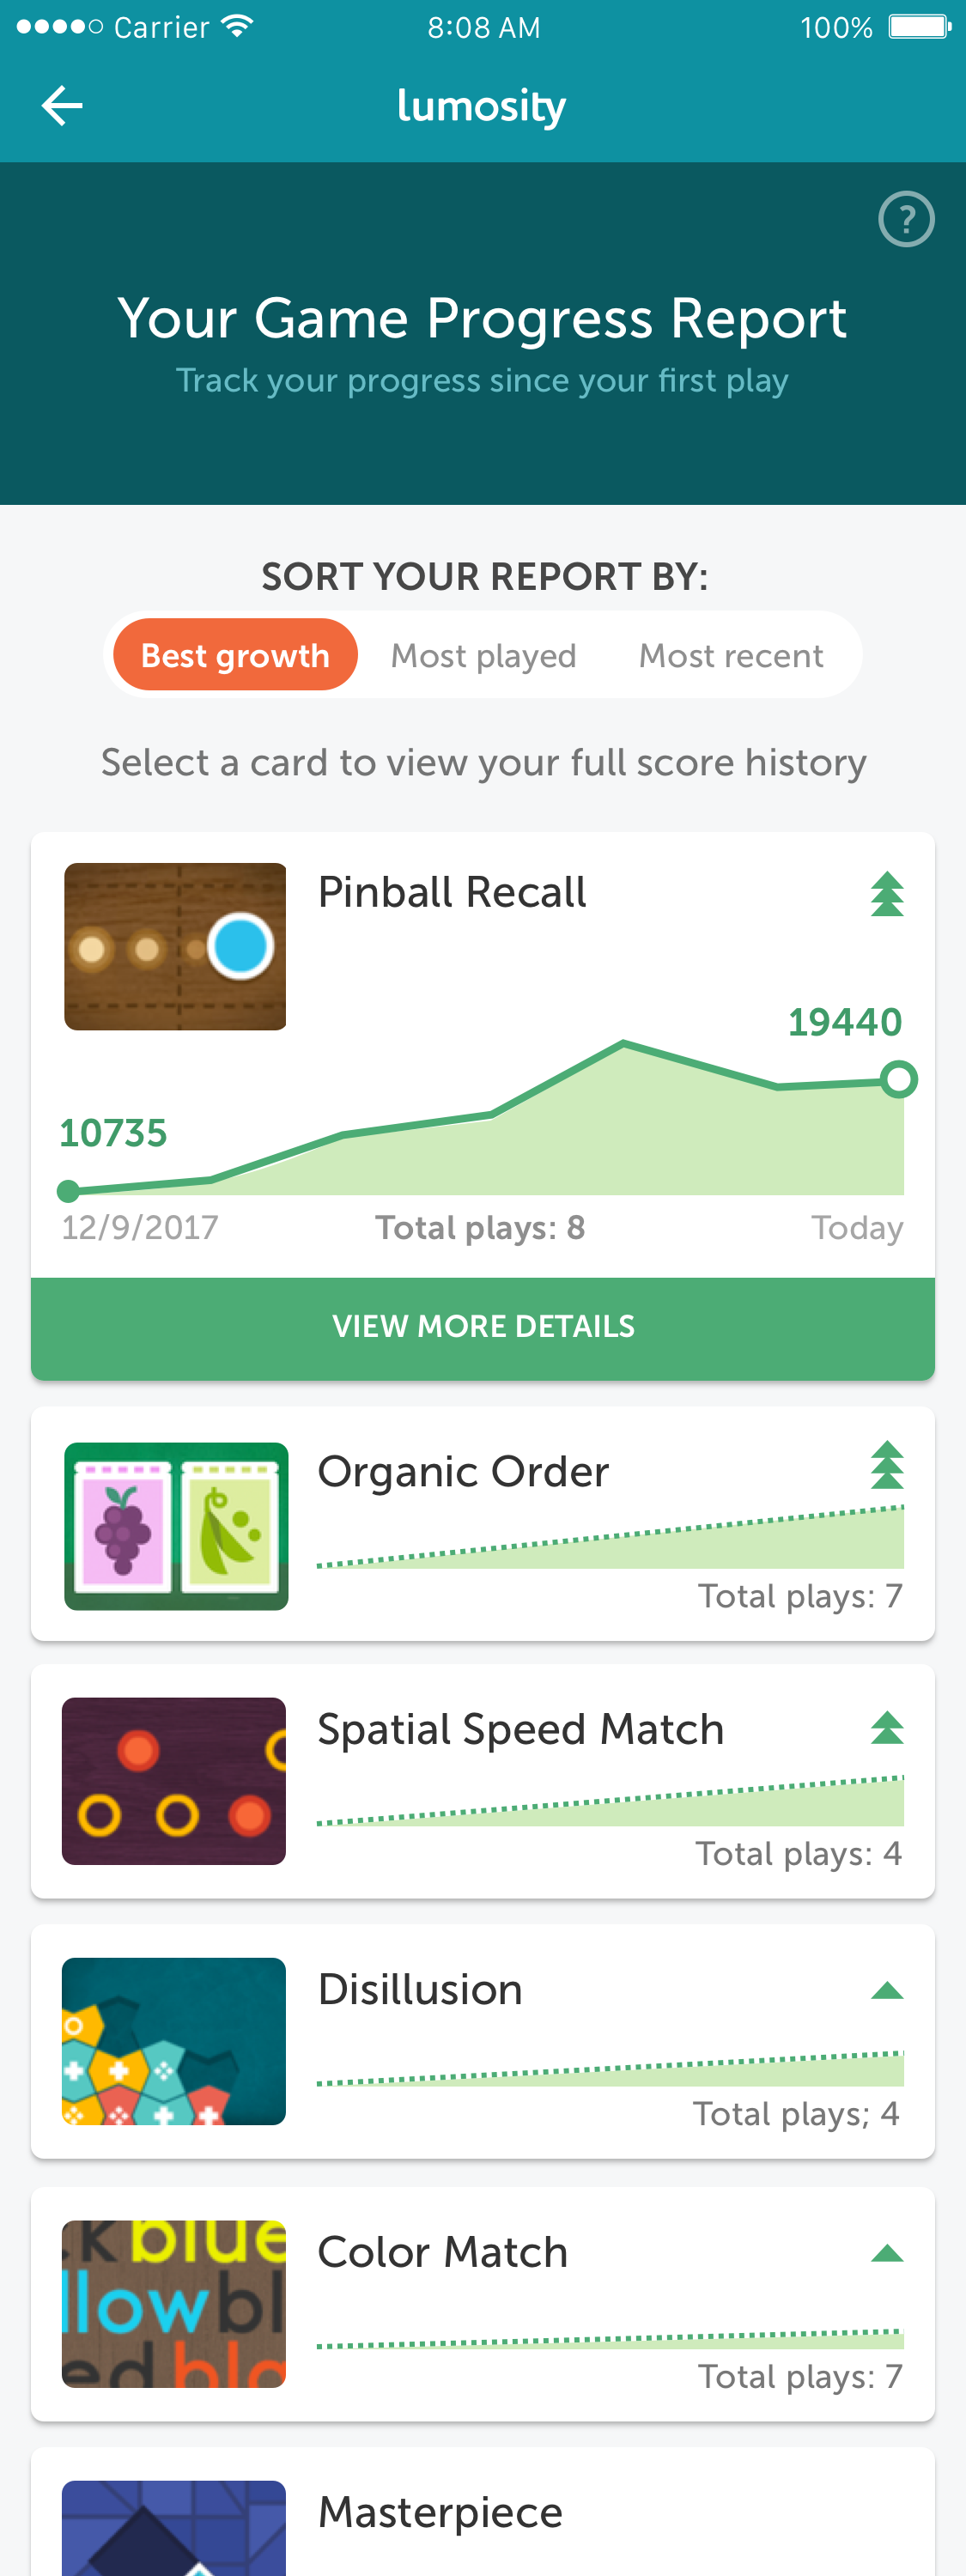
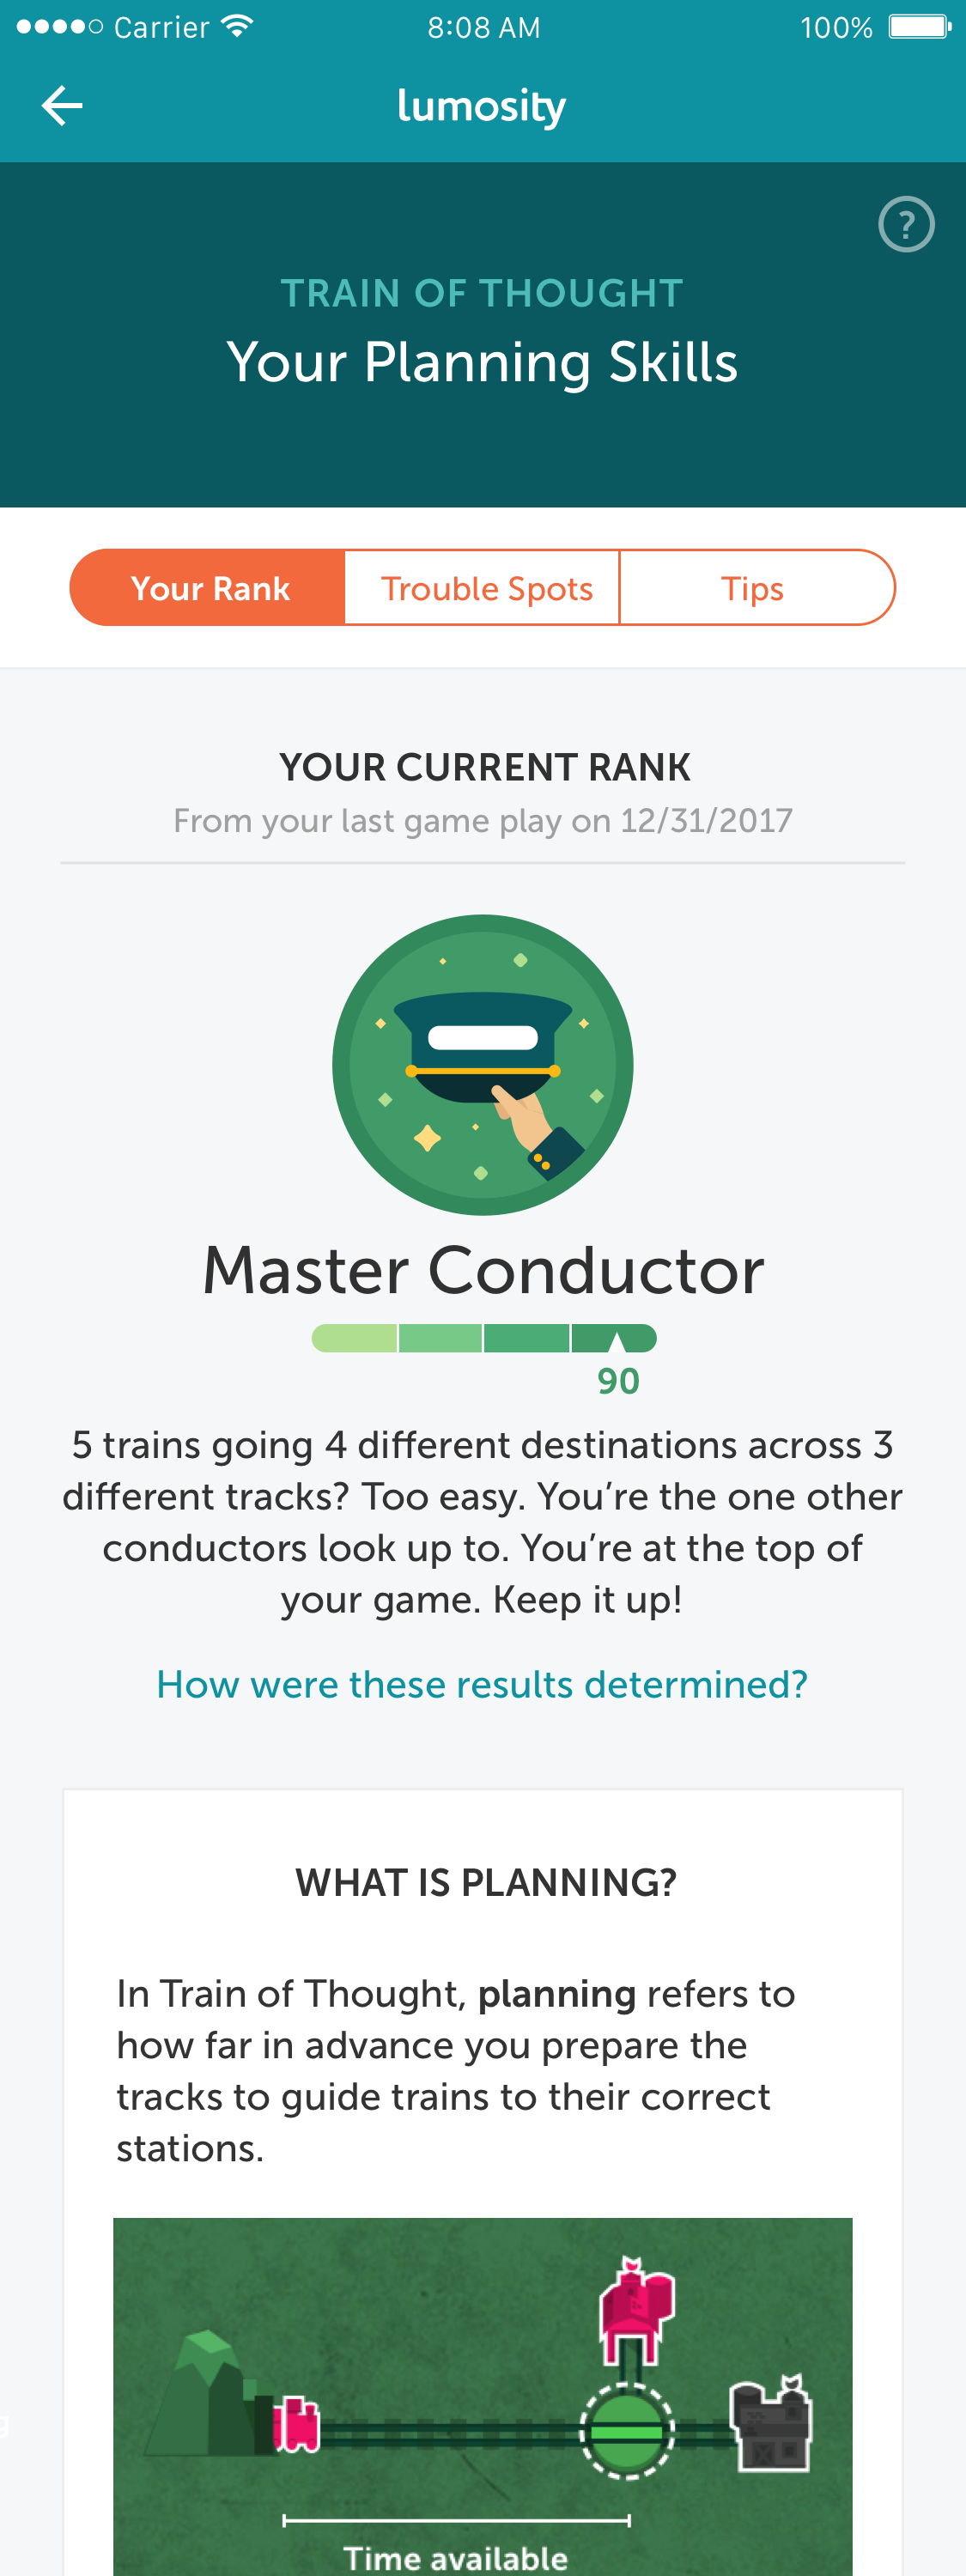
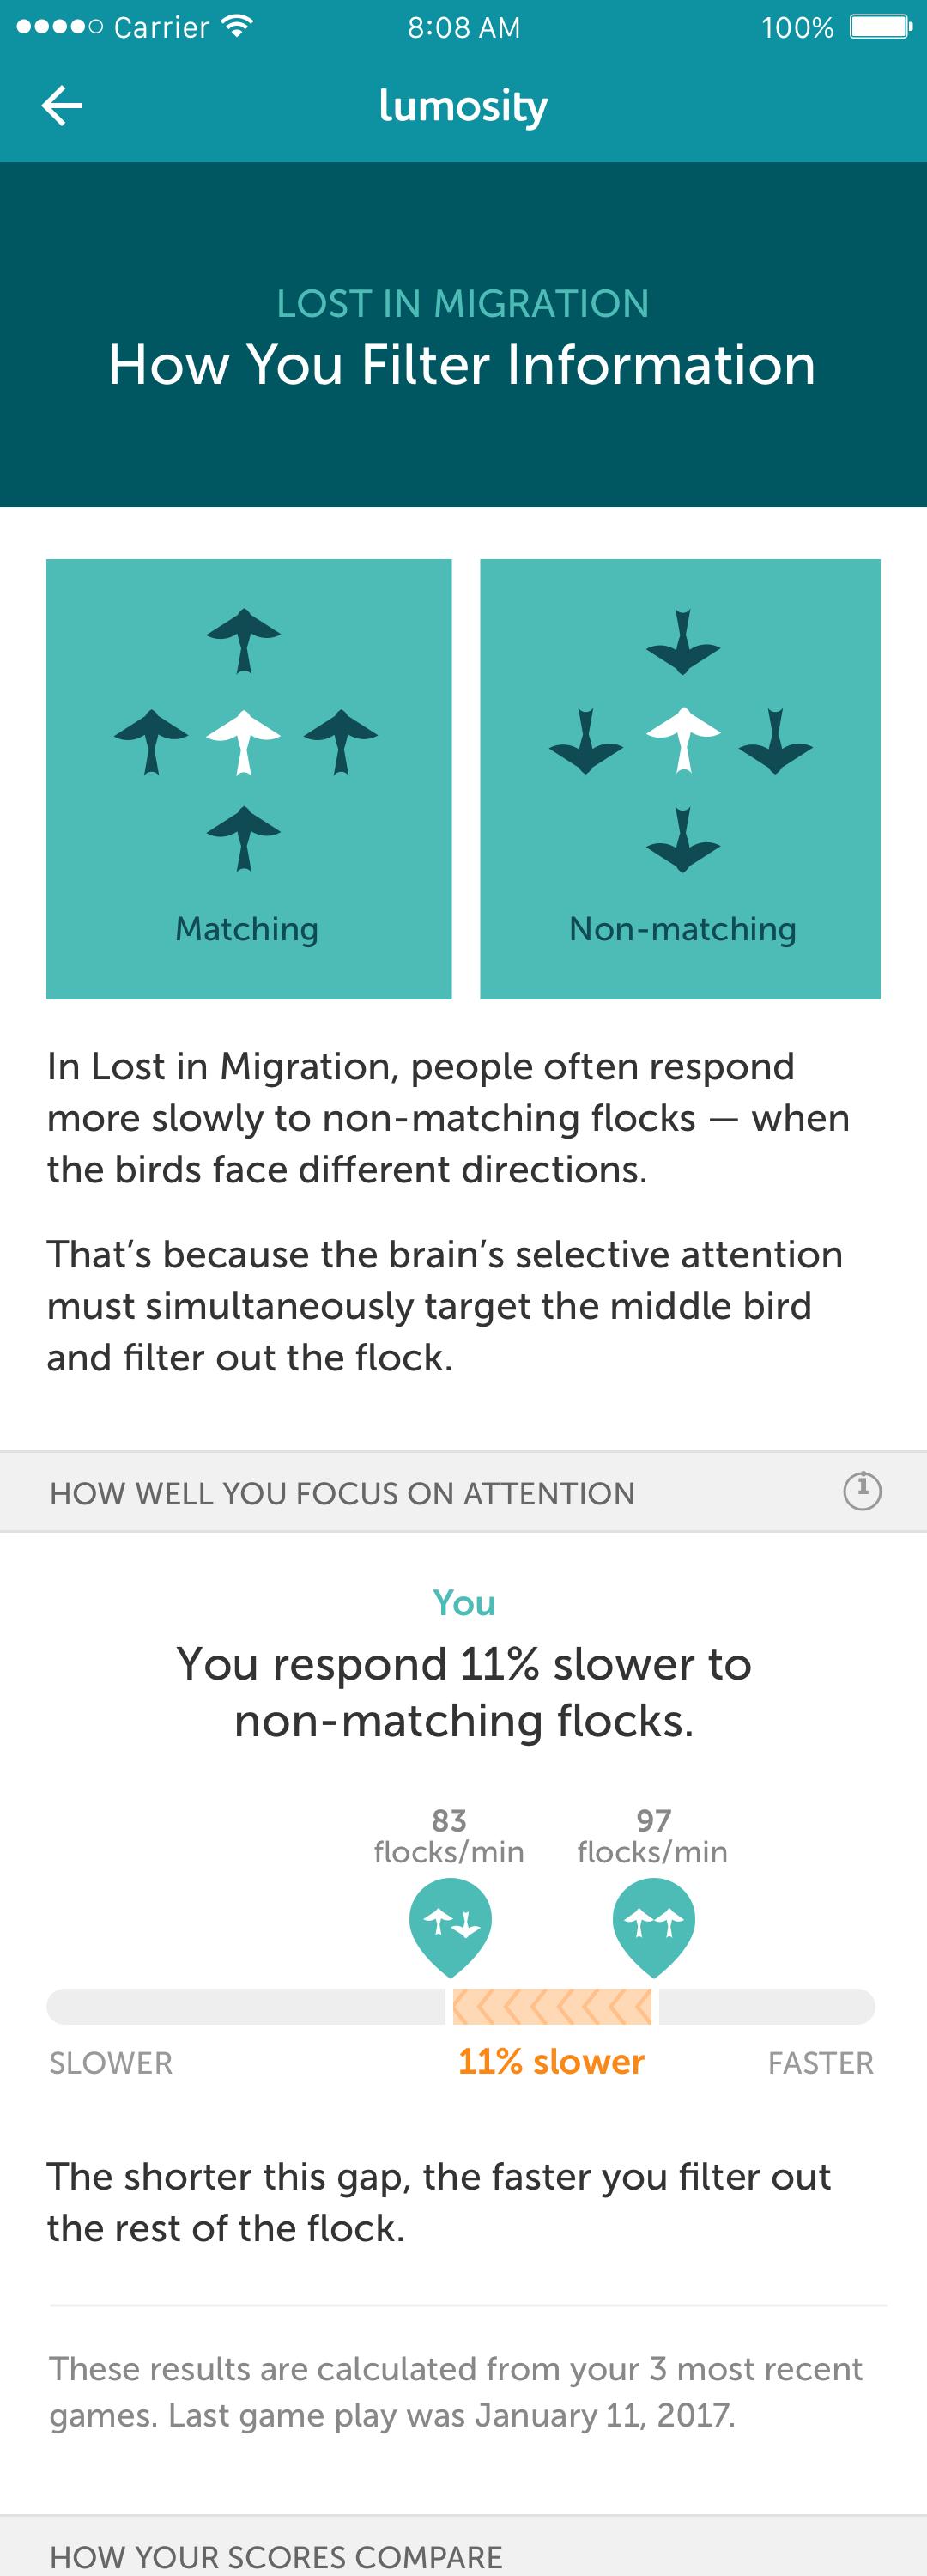
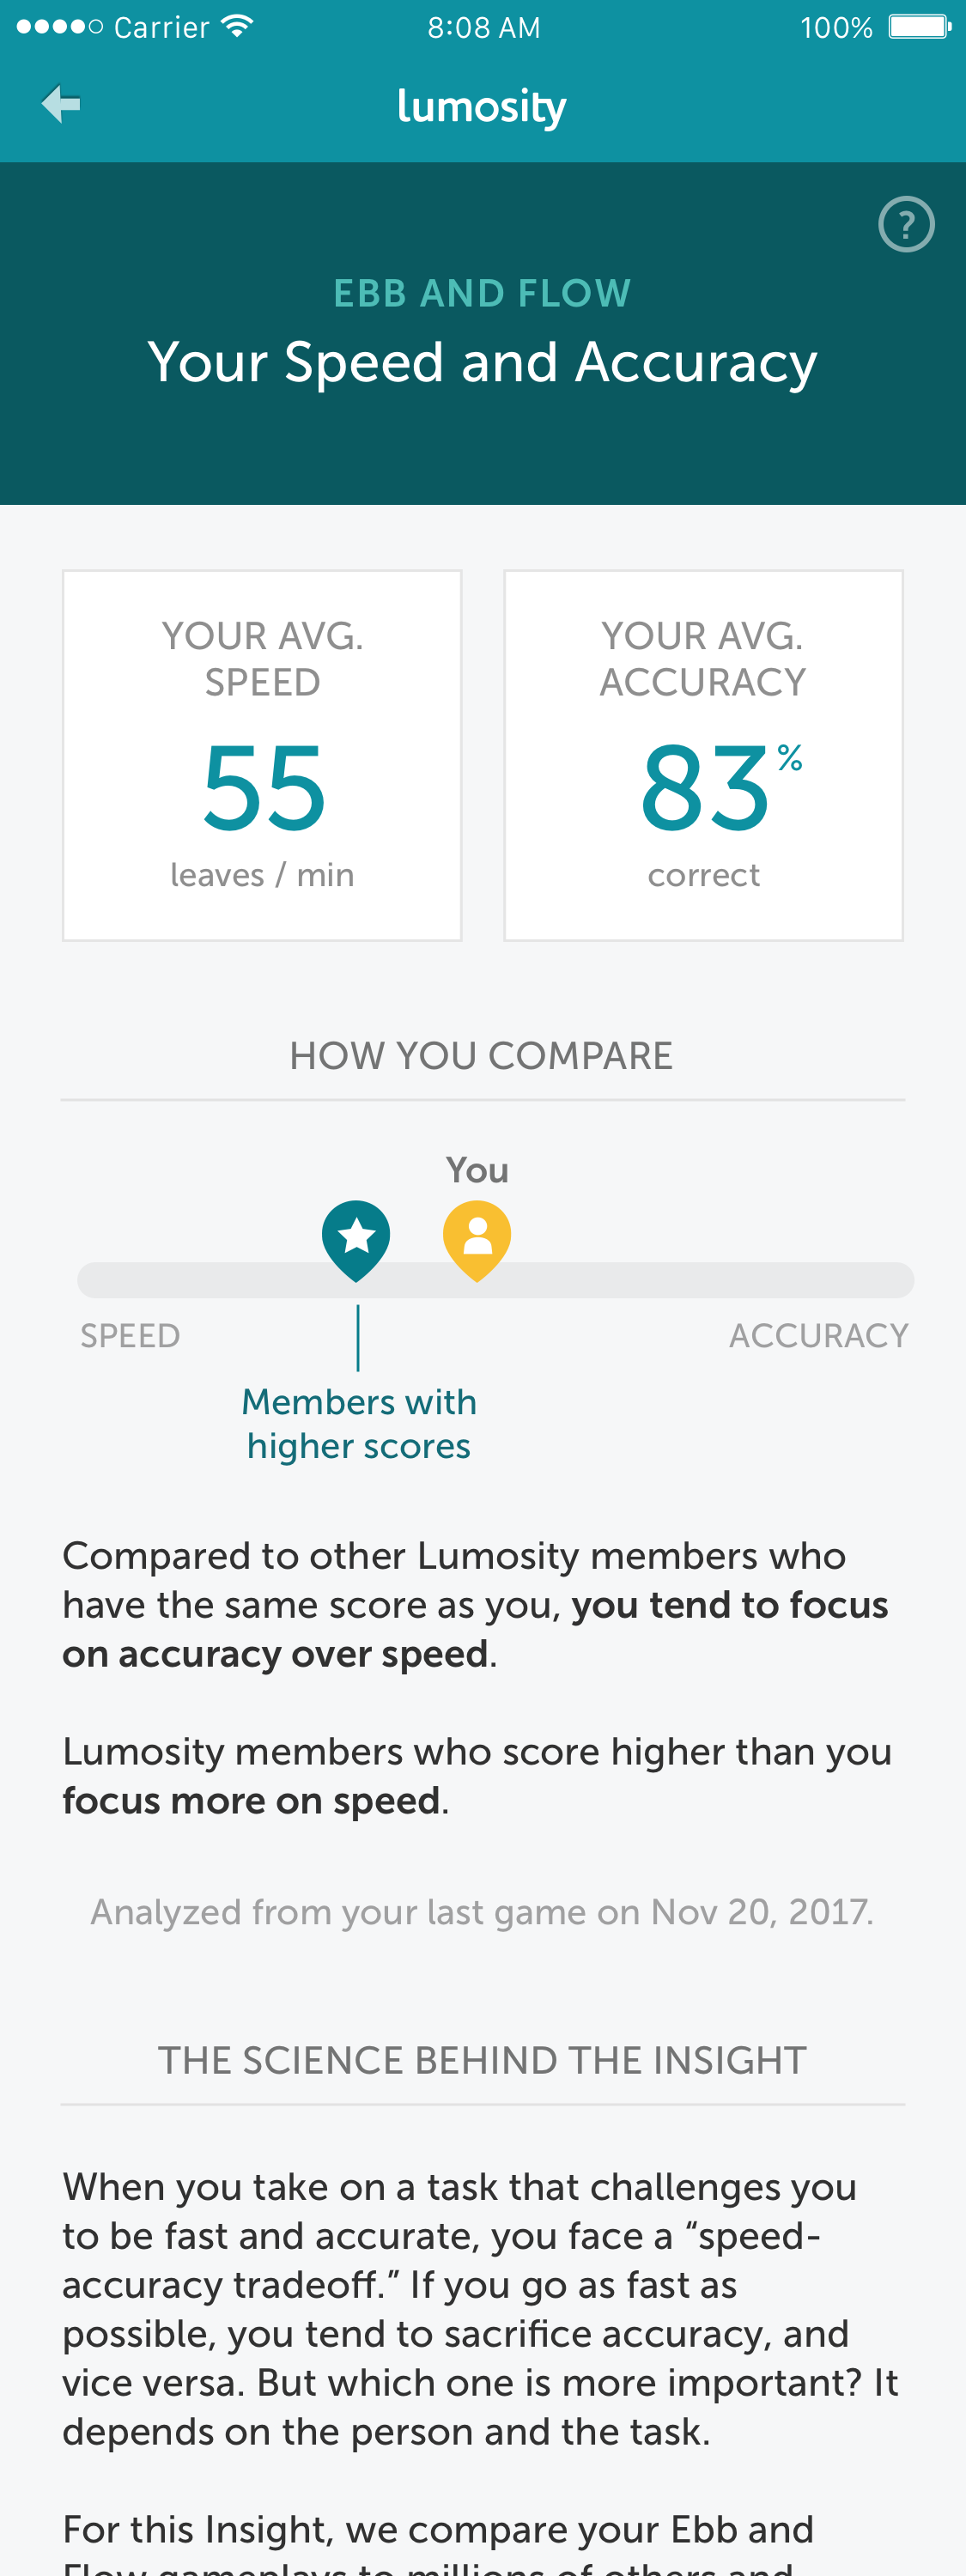
Outcomes
Our team has delivered 12 distinct, personalized Insight reports since it’s launch in January 2017. On average, that is equivalent to an Insight release every 2 months.
Insights have been driving conversion, engagement, and retention. After 2 years of Insights, we can confirm that content cadence leads to higher renewals. Renewal rates have shot up to the highest levels we've seen in at least 5 years.
Game specific insight reports drove around 2x more gameplays with each release.
Our users love insights!
Lessons Learned
Responsive web view is cheaper to build.
Insight reports were costly to build and required a lot of engineering resources on each platform. As a team, we decided it would be best to build each report in responsive web view. This proved to be a cheaper and more efficient way to build reports but it has it’s caveats:
Motion and interaction is laggy.
Top bar with back button is ever present in report view which may result in users hitting back and being unexpectedly sent back to the Insight tab.
Reports takes more time to load on device.
Reports will not be loaded when device is offline.
Ultimately, we decided that this was the best solution for the meantime because it best met our marketing deadlines and business needs and allowed us to free up resources.
It is more effective to perform usability tests with real user data rather than fake data.
Ideally, we are able to use real data in order to solicit more meaningful feedback but these analyses can take more time and therefore, we’re not always prepared. During usability tests, fake data was both confusing and frustrating for our test users. We need to work towards tightening the design/data science loop to quickly learn how a user’s experience will actually feel once the results are personalized. This will also allow us to anticipate edge cases sooner and consider what the experience could look like for low performers.
Our Insight reports are being used by highly engaged, mature users.
We will need to explore other strategies and reports to target newer, less engaged and inactive users. For instance, newer users may not have enough data or gameplays for their personalized reports to be accurate or useful. One way to target these users is to use our aggregate data to tell data stories (e.g. how different lifestyle factors can impact cognition).
Content cadence was so effective in driving business value that we had little room to try new things.
We became a well-oiled machine for delivering new content and ultimately, a victim to our own success. Having our business and marketing rely so heavily on content cadence to drive engagement meant that we didn't have opportunities to innovate and explore new experiences outside of the Insights content delivery system.


